
Posts Tagged ‘Snowflake’
Snowflake Unstructured Data – Part 3
Let me once again explain the rules. Snowflake rules when it comes to unstructured data. Tera-Tom Coffing, Teradata and Snowflake guru, will explain Snowflake unstructured data with great structure. Read the last blog of this series here.
Read MoreSnowflake Book, Training, Migration, and Query Tool
Snowflake PDF is a masterpiece by Tom Coffing and Dave Cook. Tom Coffing is considered the best technical book author in the world. Tom has written over 75 books on the architecture and SQL of all major database platforms. The Snowflake book is possibly his best work, and Tom’s co-author Dave Cook is the mastermind…
Read MoreNew Nexus is a Quadruple Threat Against Your Competition

Like a fine wine, the Nexus and Nexus Server have taken 18 years to build, and they keep getting better. Your competitors better hope you haven’t given Nexus to your employees because you now own the future of data access. You can check out a free trial of Nexus at https://coffingdw.com/download-nexus. There are four skills…
Read MoreJoin Data This Easily
Tom Coffing will show off the Nexus Desktops coordinating with the Nexus Server to join data across platforms with a single click of the mouse.
Read MoreSnowflake or Yellowbrick?

The question of the day should be Yellowbrick or Snowflake. As the great playwright William Shakespeare once penned, “To be or not to be, that is the question?” If Shakespeare were alive today, the real question would be, “To be or not to be competitive.”
Read MoreTeaching a Snowflake SQL Class Remotely this Week.
Over the next two days, I am teaching Snowflake SQL remotely to Ivy League students. I have taught close to 1,000 SQL classes over the past 30 years, and I have written over 75 books covering SQL on every database platform. I have never seen SQL so robust as I have with Snowflake. Almost every…
Read MoreMove data to Snowflake for FREE

The Ides of March is best known as the date on which Julius Caesar was assassinated at the Theatre of Pompey by members of the Senate in 44 BC. I think that 2020 is the year that we make the Ides of March a good thing. During March, I am going to allow you to migrate and move any amount of data to Snowflake for FREE.
Read MoreSnowflake Analytics – Part 11 Cume_Dist

I can teach you Snowflake analytics! Today we are going to learn about Cume_Dist. Cume_Dist returns the cumulative distribution of a value within a set of values. It represents the number of rows with values less than or equal to that row’s value divided by the total number of rows. The returned value of the CUME_DIST function is greater than zero and less than or equal one.
Read MoreSnowflake Analytics – Part 10 Nth_Value

I can teach you Snowflake analytics! Today we are going to learn about Nth_Value. The Nth_Value of Snowflake returns the nth value (up to 1000) within an ordered group of values.
Read MoreSnowflake Analytics – Part 9 Ntile

I can teach you Snowflake analytics! Today we are going to learn about Ntile. Each Ntile partition is assigned a number starting at one increasing to a value that is up to the Ntile partition number specified. So, with a Ntile of 4, the partitions are 1 through 4. Then, all the rows are distributed as evenly as possible into each partition from highest to lowest values. Normally, extra rows with the lowest value begin back in the lowest numbered partitions.
Read MoreSnowflake Analytics – Part 8 ListAgg

I can teach you Snowflake analytics! I will bet you have never seen a listagg analytic! Some major companies use the listagg analytic for their email marketing campaigns. They cleverly find out the last three web pages the customer went to on their website, and then they send them a customized email offering sales on the products they were viewing last. Let me show you exactly how it works.
Read MoreSnowflake Analytics – Part 7 – Lag

I can teach you Snowflake analytics! I have never seen a database do analytics better than Snowflake. Last week we taught you Lead, and this week we are teaching you Lag. You use a Lead to place the value from the next row on the current line of the answer set. You can then see today’s value, and on the same line, see tomorrow’s value. You do the opposite for the Lag. You can see today’s value, and on the same line, see yesterday’s value.
Read MoreSnowflake Analytics – Part 6 – Lead

I can teach you Snowflake analytics! I have never seen a database do analytics better than Snowflake. This week we are working on the Lead. You use a Lead to place the value from the next row on the current line of the answer set. You can then see today’s value, and on the same line, see tomorrow’s value.
Read MoreSnowflake Analytics – Part 5 – MDIFF

I can teach you analytics! I have never seen a database do analytics better than Snowflake. This week we are working on the Moving Difference, which is interchangeable with MDIFF. You use a Moving Difference (MAVG) to compare the difference between the value from two different rows. For example, you can see your Daily_Sales from this Monday, and then see the difference between the Daily_Sales from last Monday.
Read MoreSnowflake Analytics – Part 4 – MAVG

I can teach you analytics! I have never seen a database do analytics better than Snowflake. This week we are working on the Moving Average, which is interchangeable with the word MAVG. You use a Moving Average (MAVG) to look for trends. A MAVG shows you the AVG of values in a moving window, which means a certain amount of rows. If the moving window is a three, then the MAVG calculates the AVG for the values for three rows. You can then see trends by analyzing which results were higher and which were lower.
Read MoreSnowflake Analytics – Part 3 – CSUM
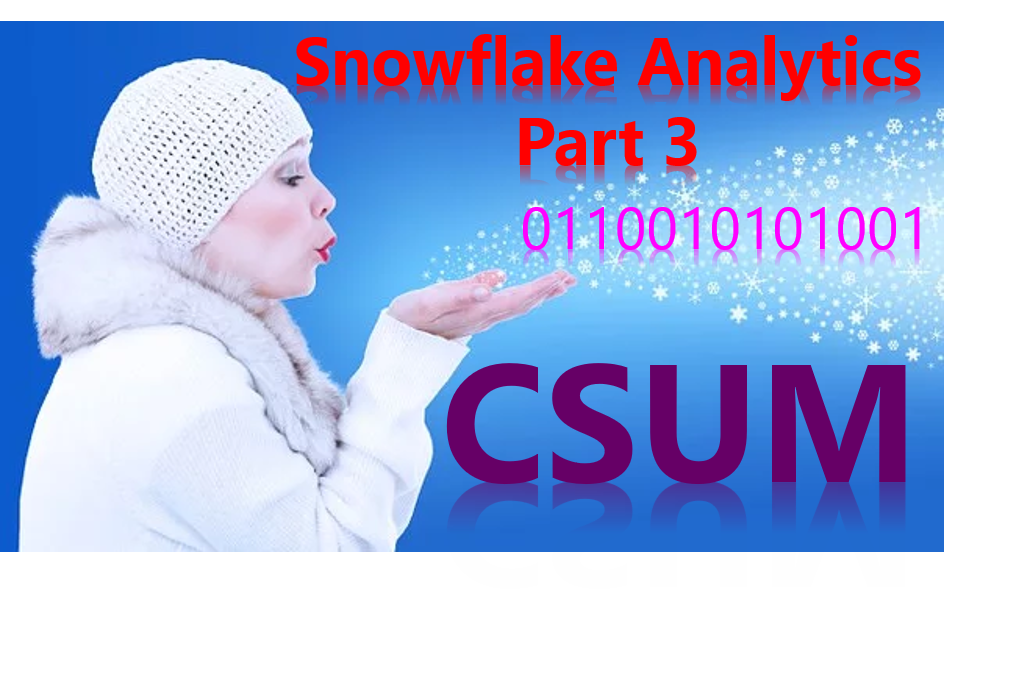
I can teach you analytics! I have never seen a database do analytics better than Snowflake. This week we are working on the Cumulative Sum, which is interchangeable with the word CSUM. You use a Cumulative Sum (CSUM) to get a running total with subtotals and grand totals.
Read MoreNexus – 1,000 Features on 1,000 Databases – Pivot

Its the data gods that say, “Go Forth and Pivot”. The Nexus has 1,000 features on 1,000 different database platforms, and feature number 942 is pivoting. Business users and senior management love to see a pivot report, especially when it has sum totals, subtotals, and horizontal and vertical grand totals.
Read MoreSnowflake Analytics – ROW_NUMBER
Yes, the Snowflake Architecture and SQL book is on its way to your favorite book stores, such as Skillsoft, where you can read it online, or Amazon, where you can buy it. It is another masterpiece of information from Tom Coffing and David Cook, two of the most famous authors in the history of computers.…
Read MoreSnowflake – The Hottest Company on the Cloud

Snowflake is the hottest company on the cloud. Find out why their unique architecture and cost structure will be the next paradigm shift in cloud computing.
Read More