Pivot, Spreadsheet, Graph, and get Analytics on Data

Query any system and then take any answer set and Pivot, or place it in a Spreadsheet, Graph/Chart it in a dashboard, or add over 80 analytic functions. Nexus makes your PC a database and analytic engine. Here are the step-by-step details to show you have powerful yet easy we have made each of these processes. You can also share any answer set with your peers!
Pivoting an Answer Set
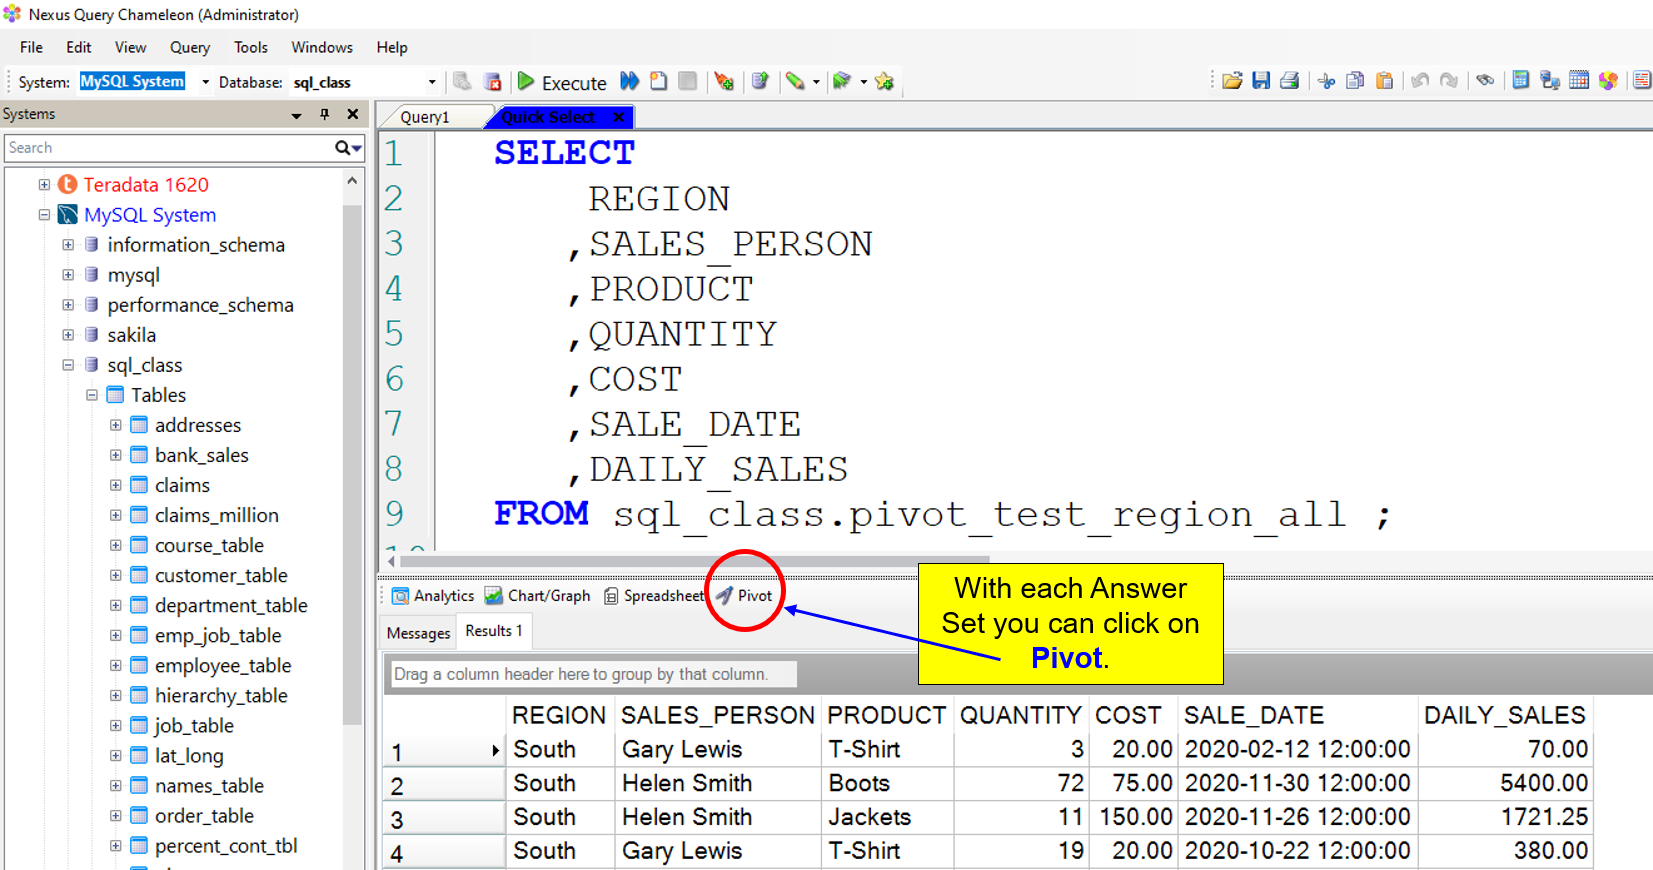
Nexus has a built-in Pivot feature so you can pivot an answer set using drop-and-drag functionality.
Run a query and get an answer set anywhere in Nexus, and then left-click on the Pivot icon, or right-click on an answer set, and choose Pivot.
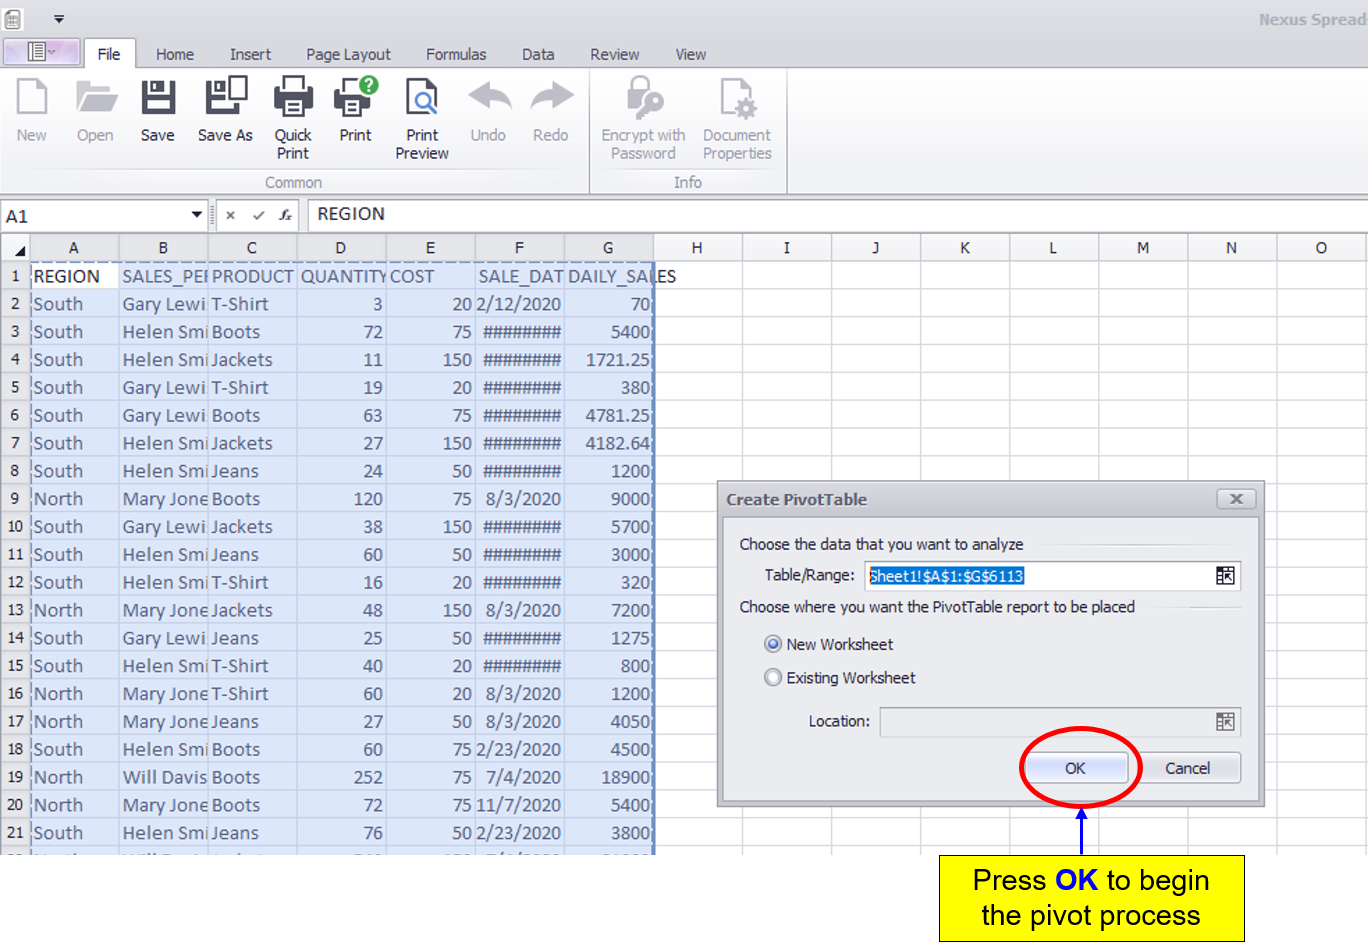
You will immediately enter the Pivot screen where your answer sets await for you to pivot. Press the OK button.
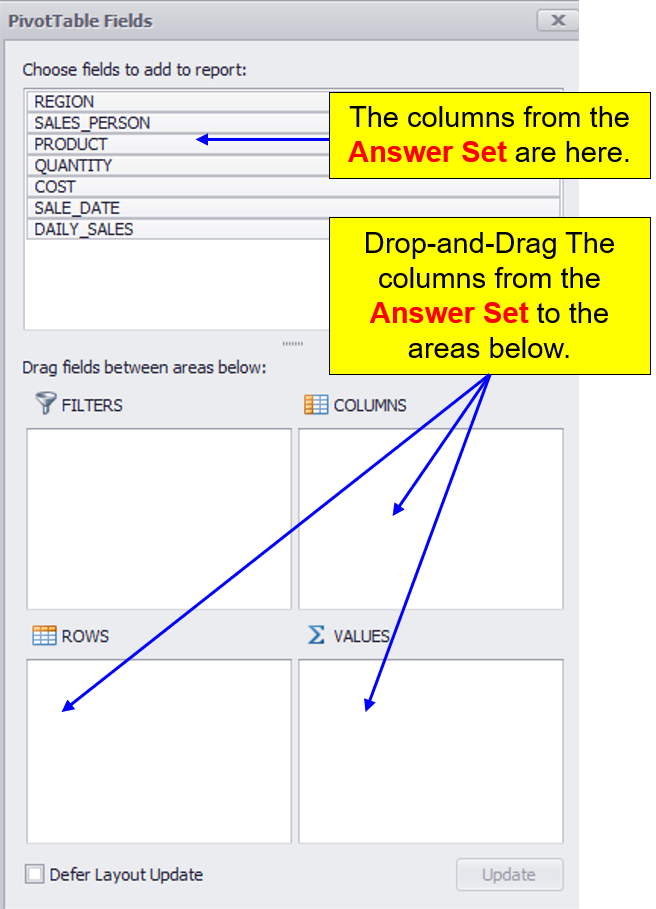
Drop-and-Drag Answer Set Columns into the Pivot Areas
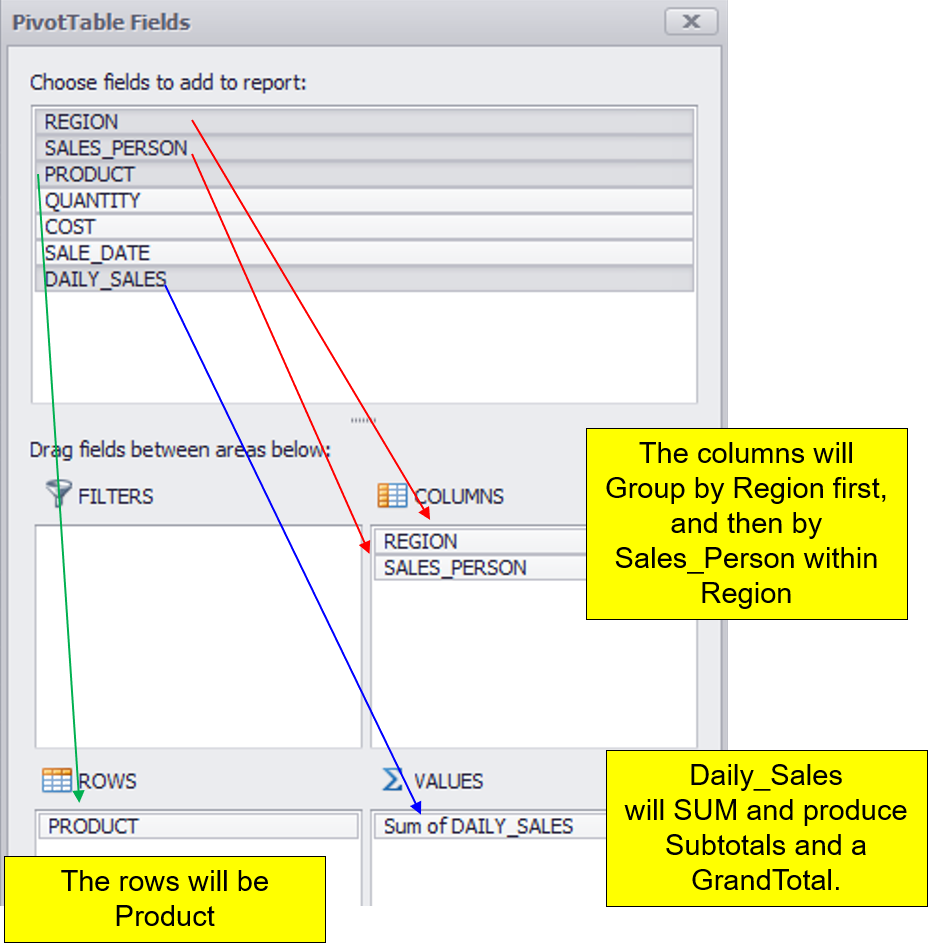
An Example of Columns in the Areas
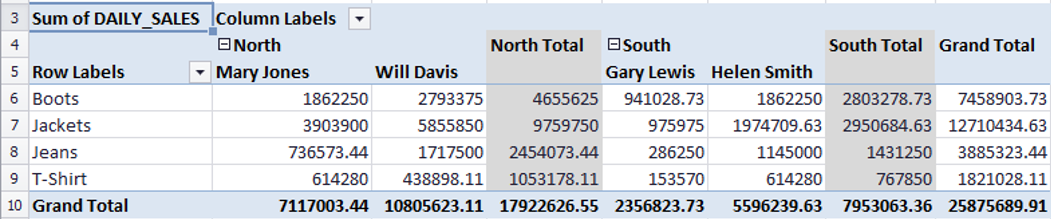
Here is the Report Produced by the Pivot
Placing an Answer Set into a Spreadsheet
Nexus has a built-in Spreadsheet feature so you can place an answer set into a spreadsheet. Run a query and get an answer set anywhere in Nexus, and then left-click on the Spreadsheet icon, or right-click on an answer set, and choose Spreadsheet.

Use the Spreadsheet Tabs for Hundreds of Options

Chart/Graph an Answer Set
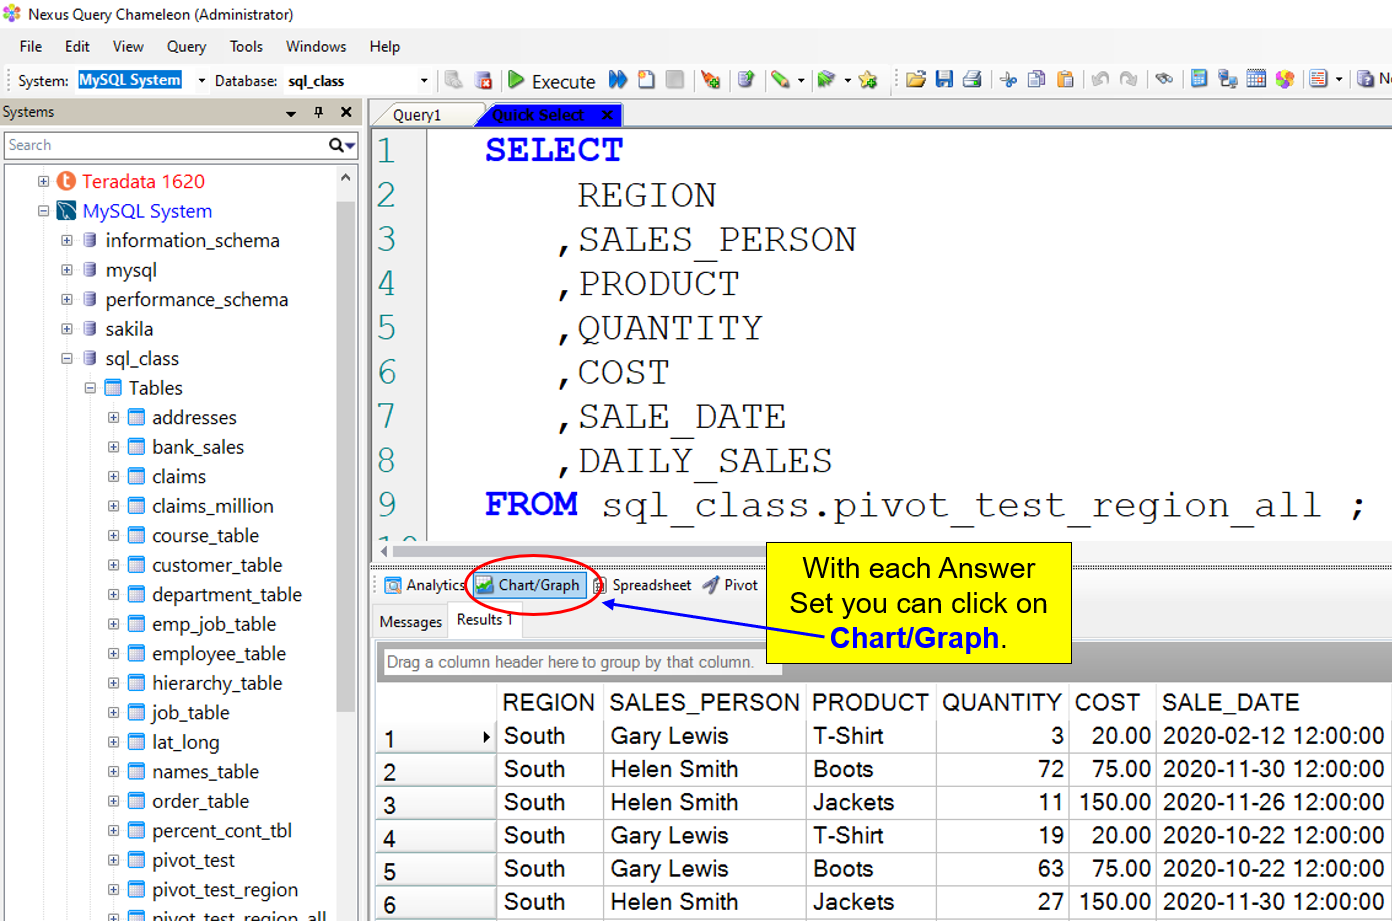
Nexus has a built-in Graph and Chart feature so you can take an answer set and get over 50 graphs/charts. Run a query and get an answer set anywhere in Nexus, and then left-click on the Graph/Chart icon.
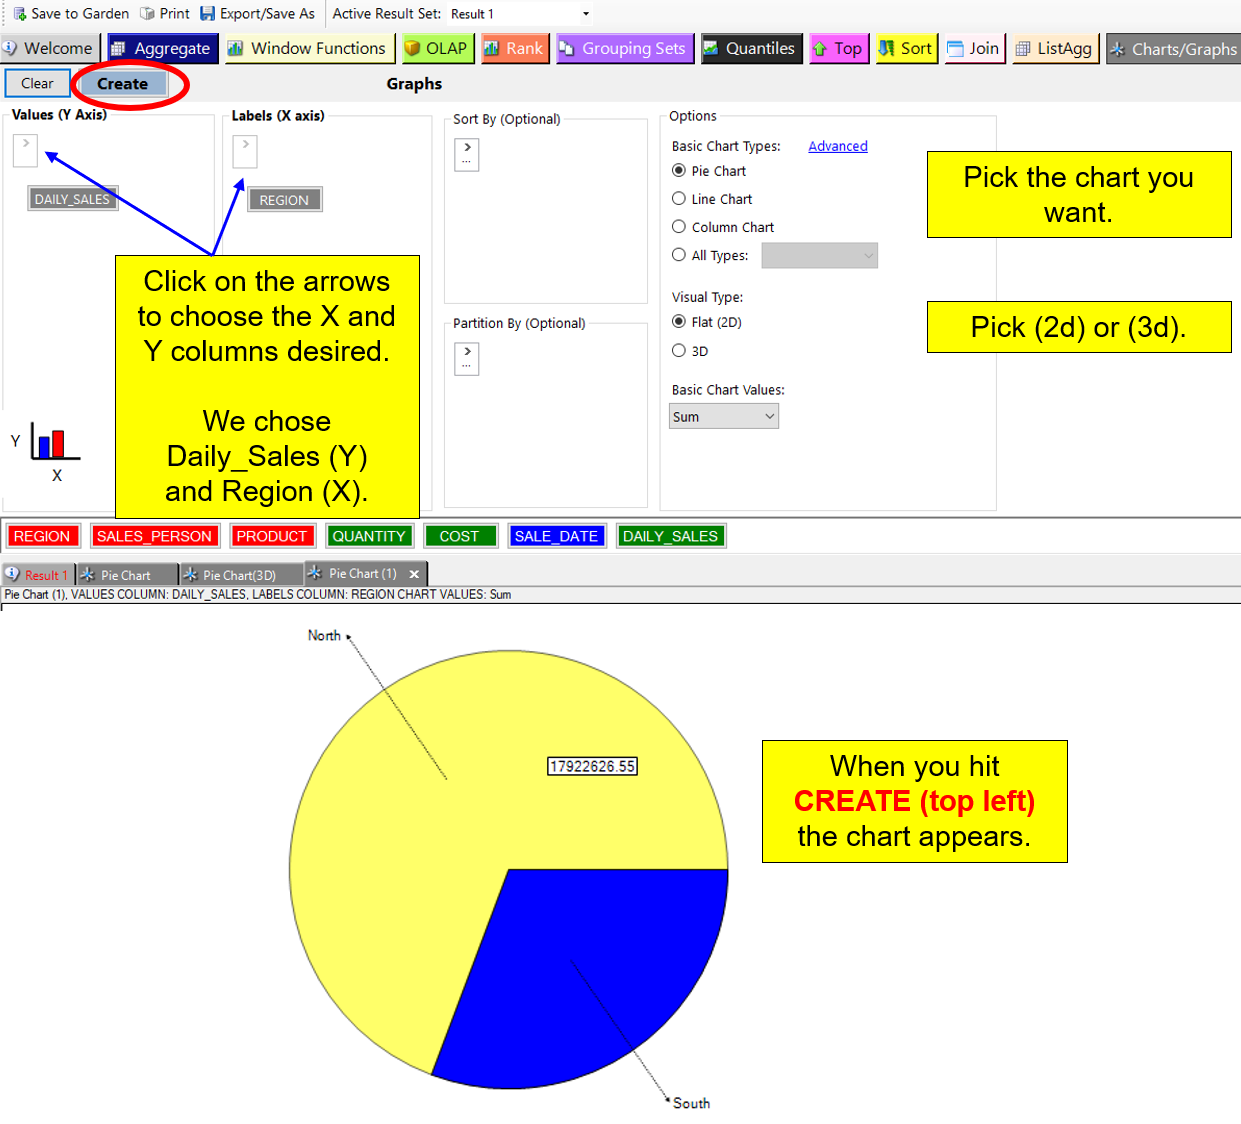
A Simple Pie Chart
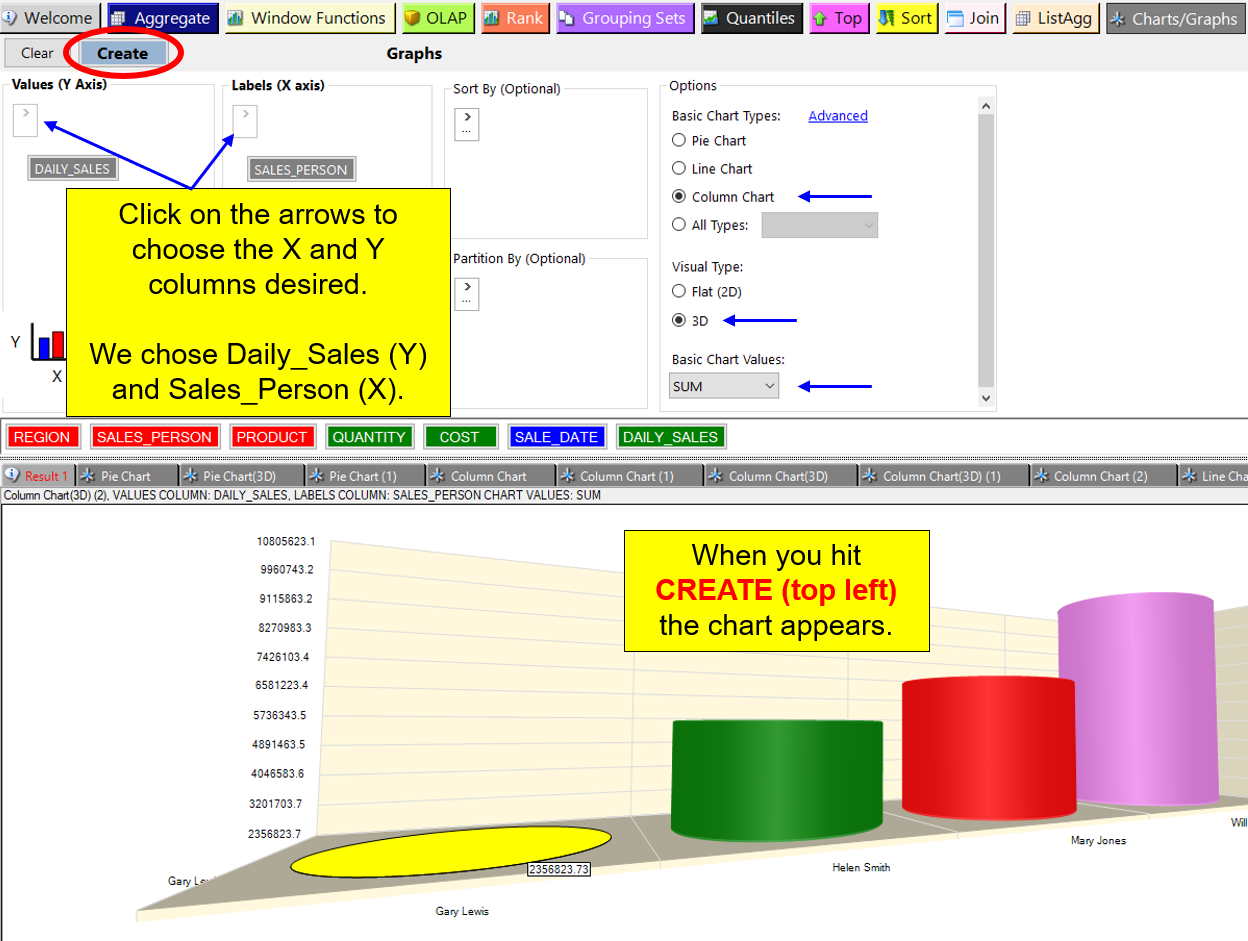
A Bar Chart
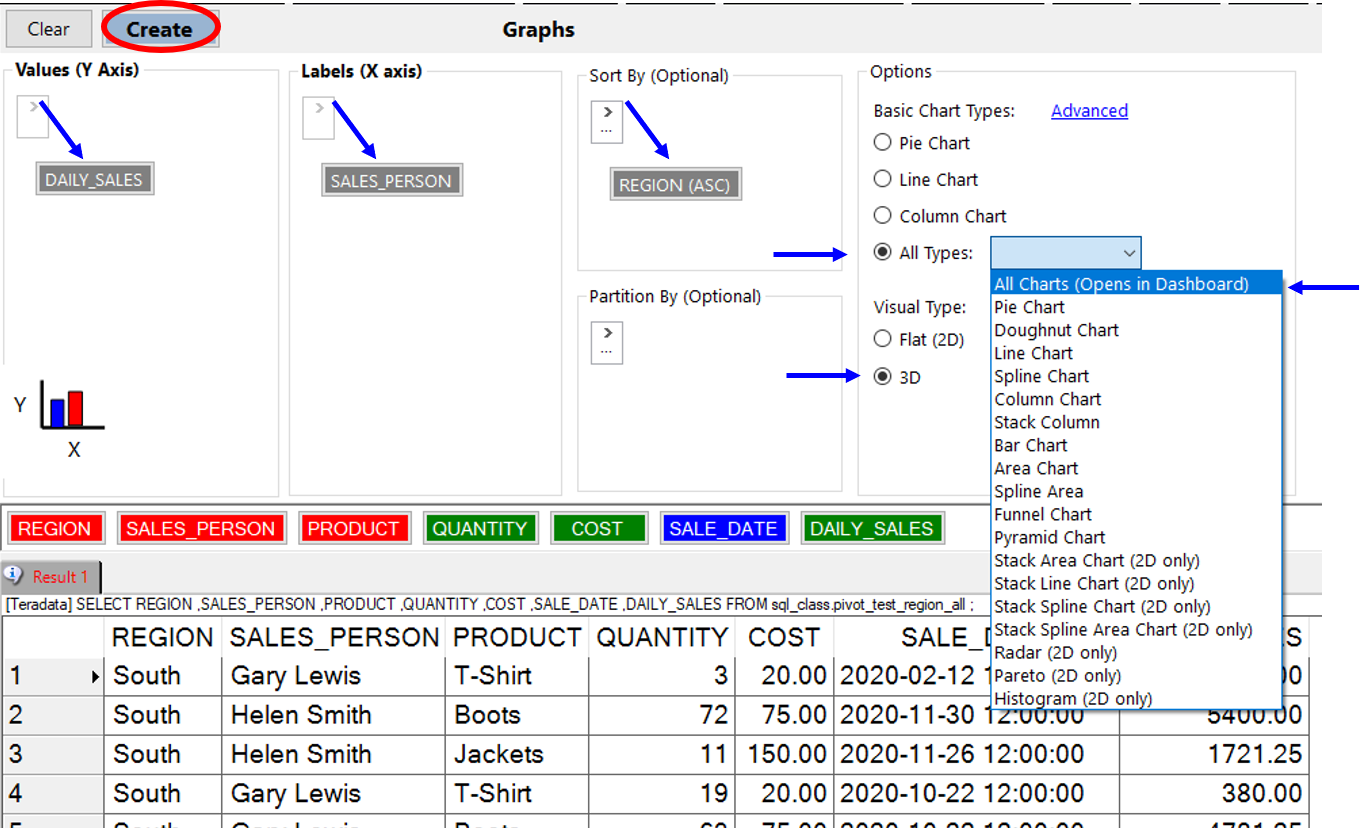
Getting All Charts in a Dashboard
Use the template arrows to choose the X and Y columns for your charts. You can also sort and partition. From the Options panel (right), select All Types. Then choose All Charts (Opens in Dashboard). When you are ready, click on CREATE (top left).
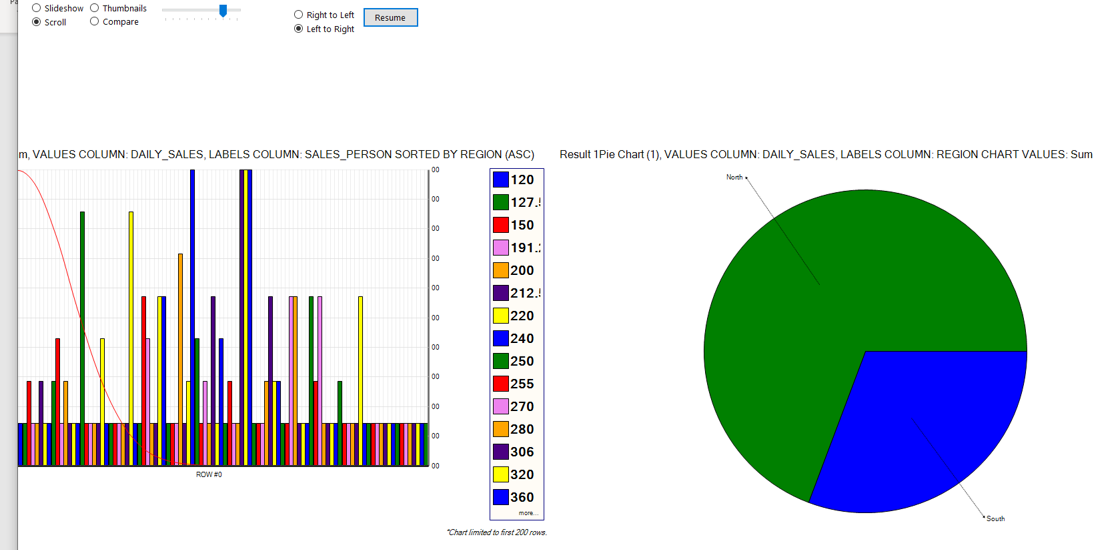
Dashboard Options
You will now be able to see your answer set in over 50 charts/graphs. You can view them in a Slide Show that shows each Graph every 2-seconds. You can change to a Scroll and see each Graph scroll from left to right, or right to left. You can view thumbnails of all Graphs. You can even compare two Graphs.
Nexus Can Calculate Analytics
Nexus has a built-in function that can calculate analytics inside your PC. Each time you run a query and get an answer set, Nexus keeps each answer set in its Garden of Analytics. You can take any resultset in the Garden of Analytics and get hundreds of additional answer sets by allowing Nexus to calculate and build reports using your PC’s CPU and memory.
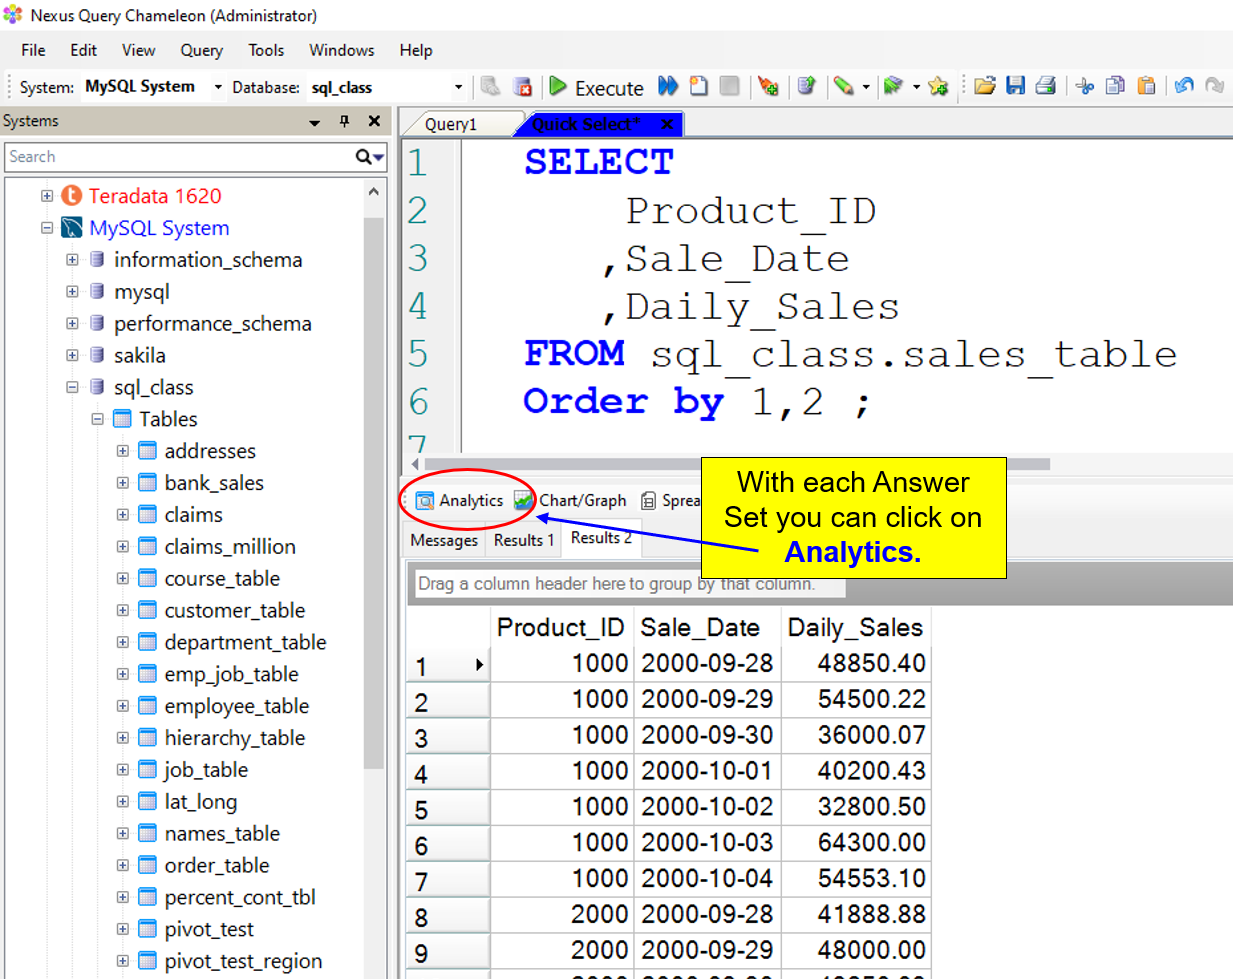
Why continue to run analytic queries against the database when your PC can do them for you quicker? Run a query and get an answer set anywhere in Nexus, and then left-click on the Analytics icon.
How to Use the Nexus Garden of Analytics
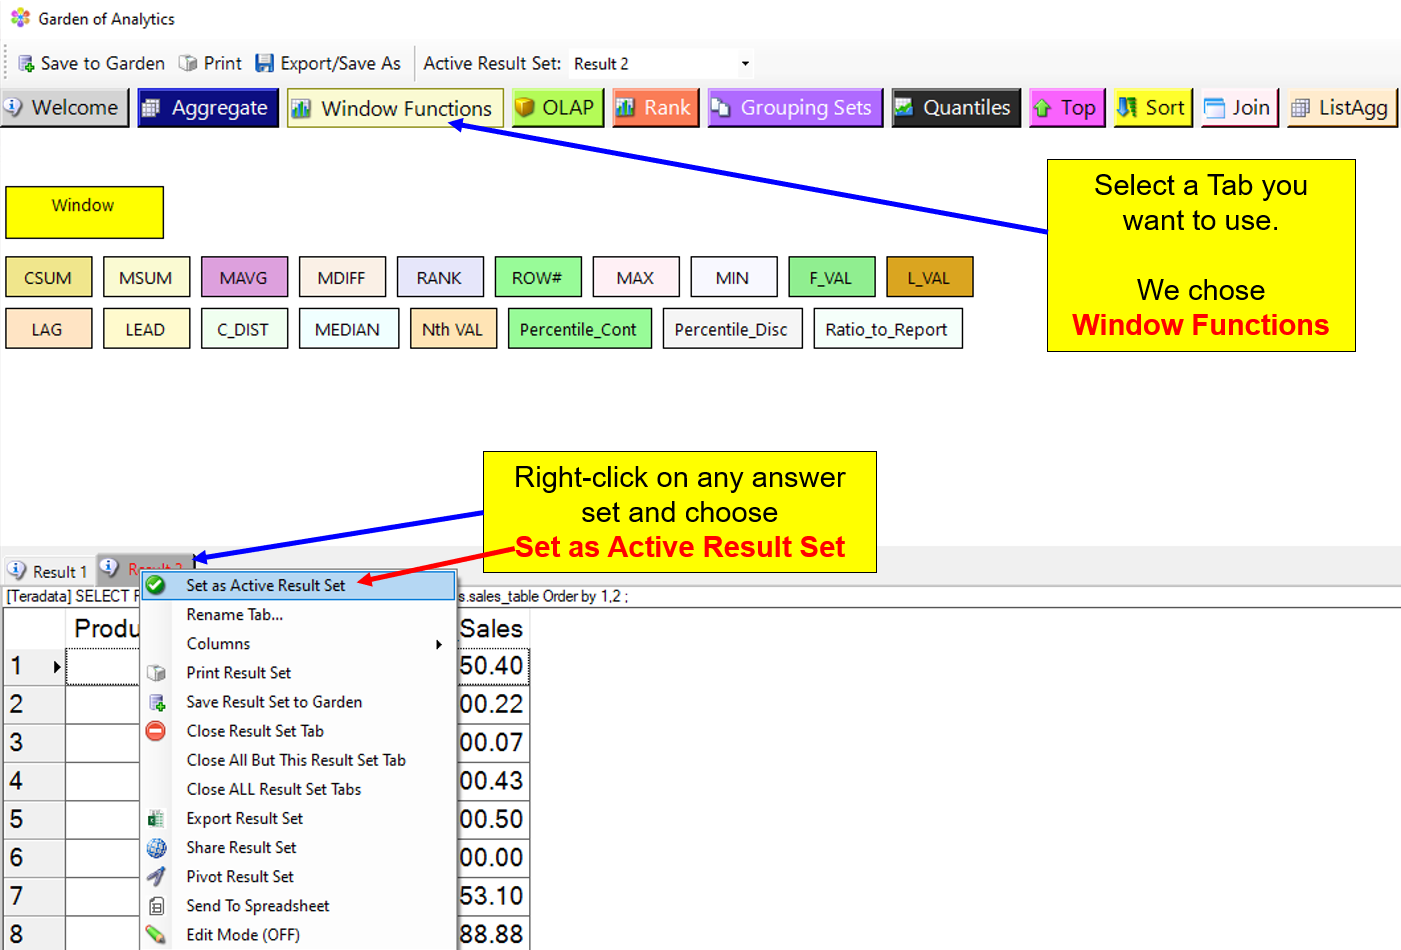
When you enter the “Garden of Analytics,” all calculations are done by Nexus by using your PC’s CPU and memory.
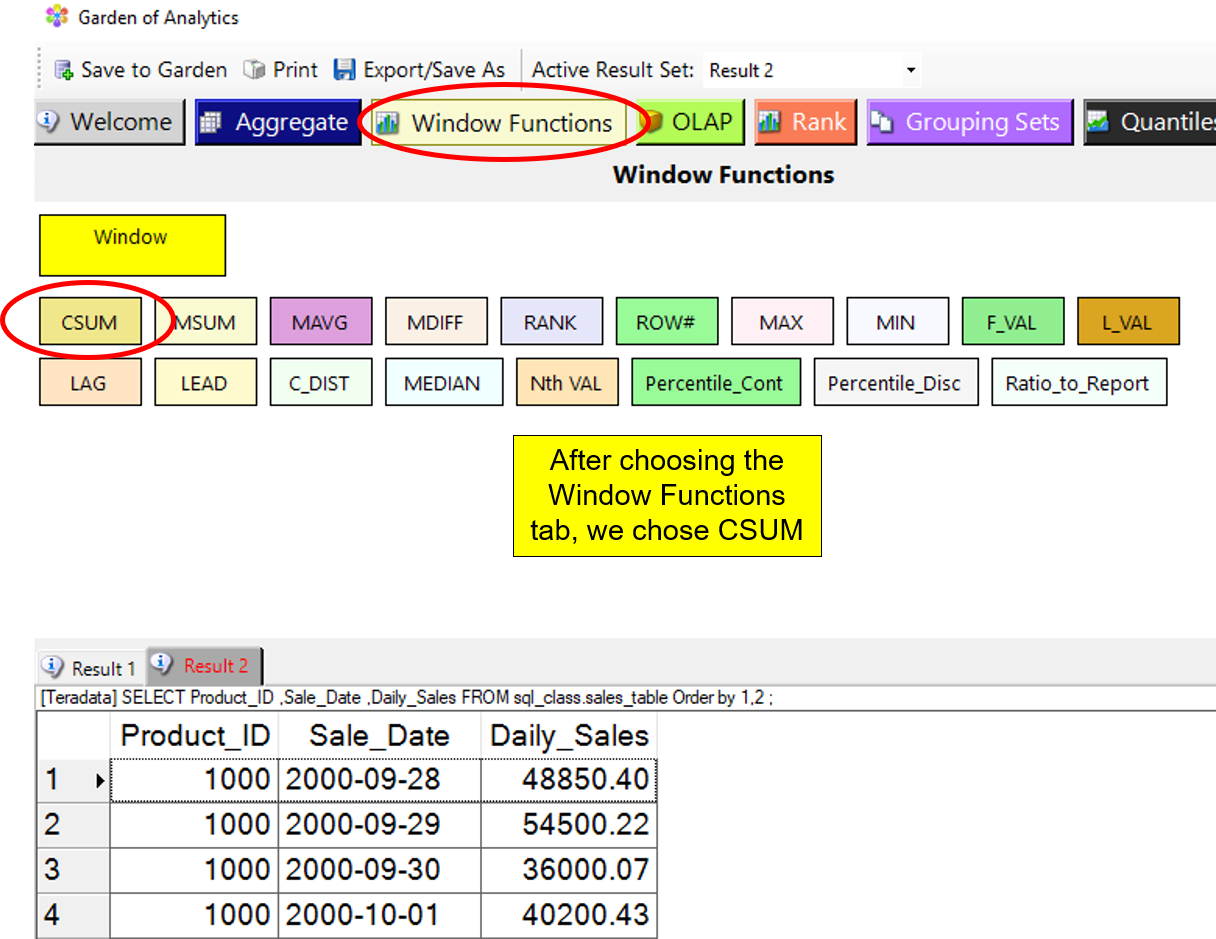
Each time you get an answer set from any system, that answer set goes into the Nexus Garden of Analytics. To get analytic reports from an answer set, you must first right-click on the answer set and choose “Set as Active ResultSet.” The result tab will turn red, indicating it is the “active” answer set. Then, you can choose from any tab to get analytic reports. Below, we wanted the Window function tab. Notice all of the Window Function options.
Getting a CSUM in the Nexus Garden of Analytics
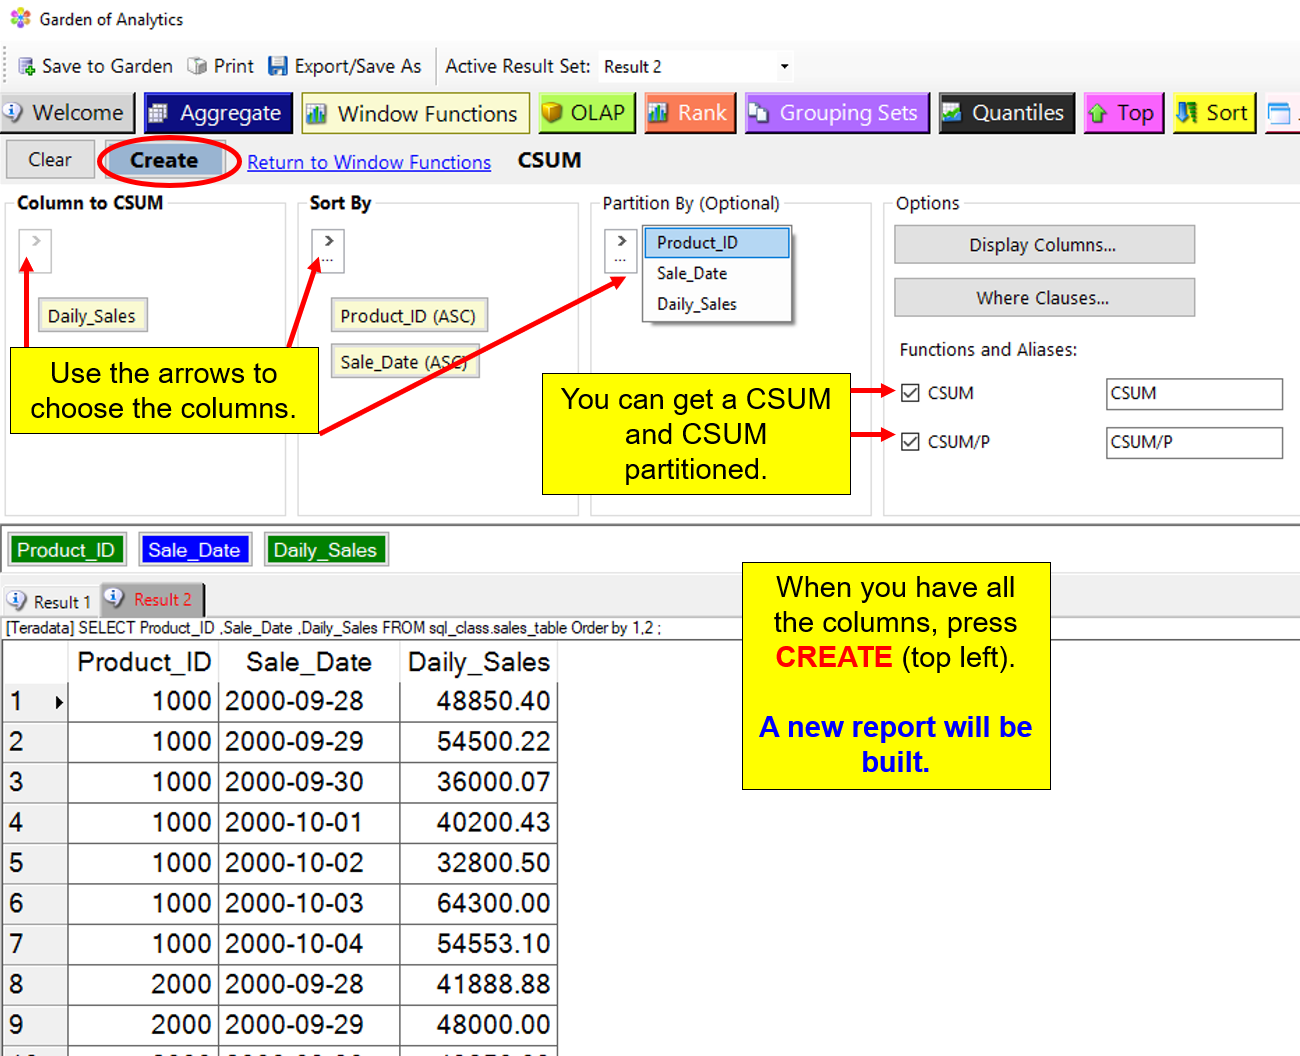
The CSUM Form
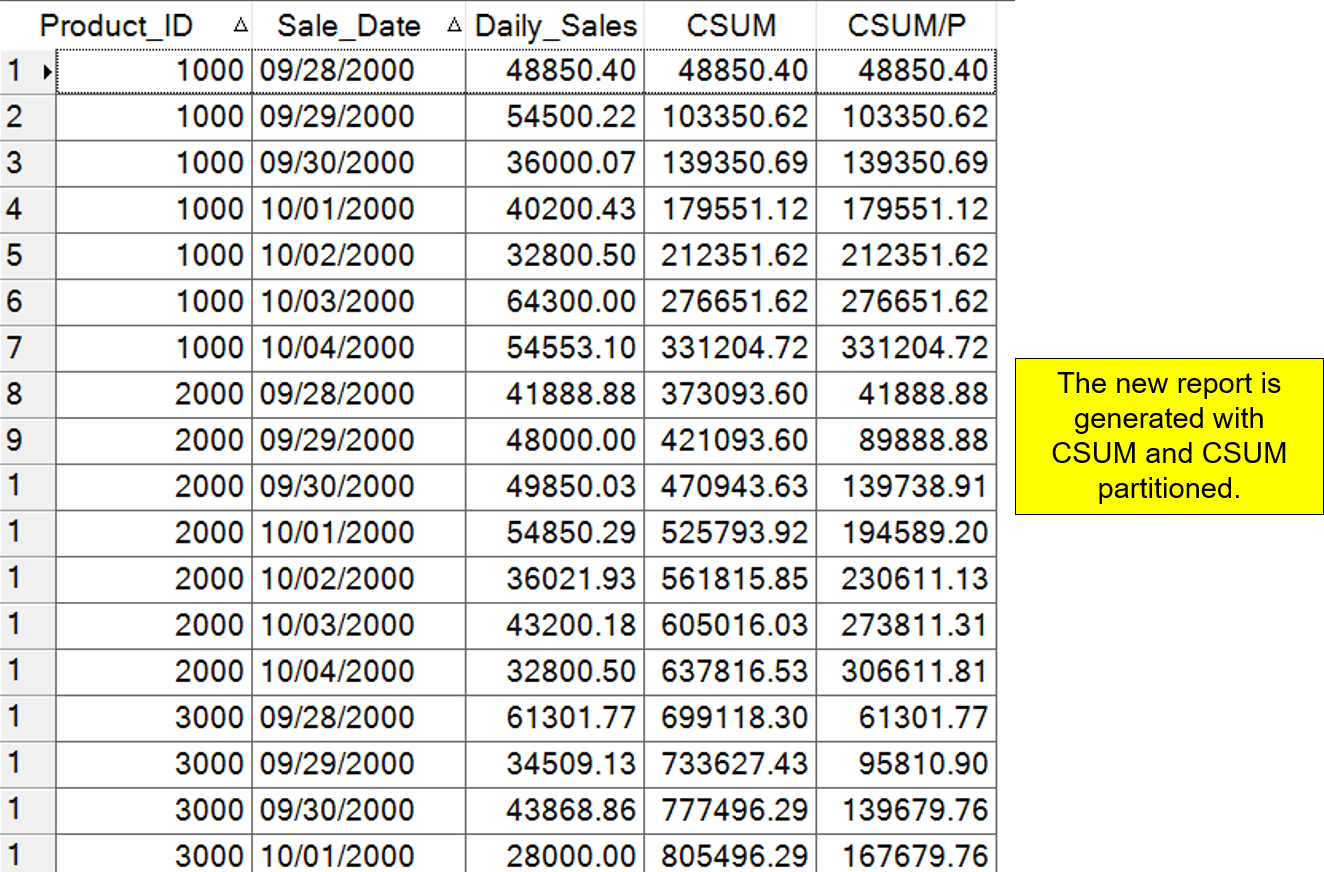
The CSUM Report
Please give me a call or drop me an email to see a Nexus demo. I will help you set everything up and then put the software in your hands for a free trial. I look forward to hearing from you.
Sincerely,
Tom
Tom Coffing
CEO, Coffing Data Warehousing
Direct: 513 300-0341
Website: www.CoffingDW.com
YouTube channel: CoffingDW
Email: Tom.Coffing@CoffingDW.com